Category Archives: Uncategorized

How Much More Height Can Be Gain From Stretching For Morning, After Waking Up Height? (Important)

This study I found months ago which I only got a chance to really go over until today has made me and potential other height increase researchers maybe rethink over the whole endeavor of what we are doing. Some startling data and claims revealed in the study below seem to suggest that even the stretching exercises we are doing has little to no effect.

Study Title: Diurnal variation in stature: is stretching the answer?

Authors: L D Voss, B J R Bailey

  • Department of Child Health, Southampton General Hospital – L D Voss
  • Faculty of Mathematical Studies, University of Southampton – B J R Bailey

Abstract

Aims—To investigate the extent and timing of diurnal variation in stature and to examine the eVectiveness of the stretched technique in reducing the loss in height.

Setting—A Southampton school.

Design—Fifty three children, divided into two groups, were measured by two independent auxologists using a Leicester
height measure. Each child was measured four times, at 0900, 1100, 1300, and 1500, using both an unstretched and a stretched technique.

Outcome measures—Height loss after each of the three time intervals for both unstretched and stretched modes.

Results—There was a clear decrease in stature during the morning, but no further loss occurred after the subjects had been up for around six hours. The mean height losses for the unstretched (stretched) modes were 0.31 cm (0.34 cm) and 0.20 cm (0.23 cm) for the periods 0900 to 1100 and 1100 to 1300, respectively, but only 0.045 cm (-0.019 cm) from 1300 to 1500. Stretching did not reduce the eVects of diurnal variation, but significantly aVected the recorded height by an average of 0.28 cm. There was no significant diVerence in reproducibility using either technique (SD 0.30 cm stretchedv 0.31 cm unstretched).

Conclusions—Diurnal variation in stature may substantially aVect the reliability of height data and careful consideration should be given to the timing of repeat measurements. As most height loss occurs in the morning, afternoon clinic appointments would be preferable. The standard stretched technique does not appear to reduce diurnal variation, nor does it affect
precision. Measurements made using an unstretched method are recommended to avoid interobserver diVerences, known to occur where diVerent observers are used.


Analysis & Interpretation:

This article is something that I have been wanting to find for a long time, which talks about the phenomena which we as height increase researchers have known for so long, which is that after we get out of bed from going through a regular cycle of sleeping, we actually are a little taller, and over time, that height drops throughout the hours that we are standing up and awake. The general belief is that the intervertebral disks are being compressed.

It seems that there is a scientific term for this phenomena called “Diurnal variation” and there are quite a few studies that the article references which talks more about the phenomena known as diurnal variation.

Getting back to the original point of this point, I am asking and trying to answer two main questions..

  1. How much height on average is lost by adult people (assuming they are male and between the adult height of 5′ 6″ – 6′ 0″)?
  2. How Much height can be regained if we did stretching many hours after waking up and we already experienced diurnal variation?

I refer to a few select passages that I found from the article…

“…confirm the presence of diurnal variation in the adult. Most agreed that the total loss amounted to between 2 and 3 cm, and the evidence suggested that the greater proportion of the decrease in height was occurring in the trunk.

some studies also showing that much of the height loss can be restored by taking a short nap. Almost all reports agree that the greater proportion of the decrease in stature appears to occur soon after rising, though it is assumed that, without a nap, further loss continues throughout the day

Even in studies using larger numbers, one found a mean decrease in height of 1.54 cm in 100 children between rising and late afternoon, whereas another found a mean decrease of just 1.0 cm in 70 boys between early morning and bedtime

A stretching technique did become widely adopted about 20 years ago, however, after Whitehouse et alsuggested that ‘gentle upward pressure on the mastoid processes’ could minimise the eVects of diurnal variation.11 Indeed, these authors claim to have shown that, using this technique, loss in stature between morning and afternoon, though not entirely eliminated, can be reduced to a maximum of 0.46 cm.

The aims of the present study were twofold: (a) to ascertain the time of day at which height loss eVectively ceases; and (b) to examine the eVectiveness of stretching in reducing diurnal variation in height”

What the selected sections shows is that the height loss seen in people, but children for this experiment example is around 2-3 cms, or 1 inch. Some smaller groups of subjects showed even smaller height loss, just 1 cm. The thing that is noticed is that the height is lost from the trunk (torso). Most of the height loss happens right after a person gets out of bed, in the early hours.

This is the biggest thing that can be taken from the study….

“Figure 2 clearly shows that, on average, stretching added a constant amount to the unstretched height, but did nothing to reduce the diurnal loss of height…”

This shows that stretching can cause a very small amount of height increase in people who have already experienced diurnal loss of height, but that amount is usually slightly more than 3 millimeter or 0.003 meters in difference (it really is that small)

In the discussion section, the researchers reveal their conclusion which reveal what I had seen from obsessive measuring of my own height many years ago…

The present data confirm both the existence of diurnal variation and that the greater proportion of the height loss occurs during the earlier part of the day. Over the period 0900 to 1500 we found an average decrement of around half a centimetre, though several children lost well over 1 cm regardless of the method used (fig 1). On average, the largest decrement occurred during the first time interval, 0900 to 1100.

Once a child has been up for six or seven hours there appears to be no further discernible loss of height—the timing of afternoon appointments can therefore be more flexible and measurements made after 1300 can be repeated at any other time in the afternoon.

This is the part which also is sort of an eye-opener in terms of revelation.

Though commonly used, the technique of stretching does not appear to have any advantages. It simply increases the measured height, in this case by almost 3 mm. This amount appears to remain constant, irrespective of the time of day at which the height is measured

There is some confusion over this term; there can be no such thing as the ‘true height’ of an animate body, only a mean height, with variability about it….The aim is not to record the maximum height possible, but a height that can be easily reproduced

Stretching was therefore ineffective in reducing the stature lost during the course of the day, as suspected by Buckler.

So to the two question above, the answers are….

  1. The average amount of height loss due to diurnal height loss is around 2-3 cms for most adults.
  2. The amount of height gain that can be achieve is only about 3 millimeters. That gain will not be effective in reducing the loss of height over the course of a day.

These results are very interesting because they seem to go against everything that we as height increase researchers would hope for. Where I had hoped that we can increase our height 2-3 cms, maybe even 4 cms, it seems that the more likely result from stretching is only a few millimeters.

There are of course exceptions to the rule on how much of extra height can be regained like with the TightSkinFlash guy on Youtube. I did a post about the guy in the post “Reviewing A Height Increase Success Story By SkinTightFlash From Youtube, A Lance Ward Supporter”This guy gained a little more than 1 inch from 3-4 hours of daily stretching. He went from 5′ 7″ to 5′ 8″ which is quite impressive. However now I say that his case is an outlier, something that most of us can’t expect anymore.
Compositions On Elastic Cartilage, Articular Cartilage, And Fibrocartilage

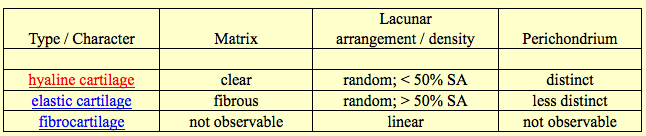
I wanted to spend this post looking at the compositions that are found inside all of the cartilage types, which would include the elastic cartilage, the articular cartilage, and the fibrocartilage. This would help us know what exactly makes up the cartilages that we need to get our bones to lengthen naturally. From doing just a basic google search, I have found two sources which have shown to be very informative.

Note: I will not be restating information that most of us wold already know by now so I will focus on the type of information that are new or insightful

Source #1: School of Anatomy and Human Biology – The University of Western Australia – Blue Histology – Skeletal Tissues – Cartilage

Source #2 at Indiana University – Purdue University Indianapolis: ANAT D502 – Basic Histology – Cartilage, Bone & Joints, Bone Formation Pre-Lab – revised 9.23.12

From Source #1:

For cartilage in general, they seem to have no blood vessels or nerve cells going through them, unlike so many other types of tissue. They are also surrounded by a dense layer of connective tissue known as the perichondrium. it is noted that cartilage in adult humans is very rare. they have the properties of being firm and having the ability to grow rapidly. Cartilage is important in development. They are created when a bone is fractured and is repairing.

Hyaline Cartilage

So the first type of cartilage that the source looks at is the hyaline cartilage. When a baby before birth still in the fetus form is growing and developing, the precursor cells for chondrocytes, the mesenchymal cells go into a rounded shape and form a densely packed cellular mass called a chondrification centres. There is a chondrocyte forming cell called a chondroblast and they start to secrete the components of the extracellular matrix. There are many substances that are in the extracellular matrix of cartilage but these are the top 4 components.

  1. Hyaluronan
  2. Chondroitin sulfate
  3. Keratan sulfate
  4. Tropocollagen

The tropocollagen is said to polymerize into collagen fibers that are thin in shape. Whatever the tropocollagen is, the type II of tropocollagen is the dominant form of collagen in all cartilages.

The matrix between the chondroblasts will get bigger and the chondroblasts will separate further from each other in distance. The chondroblasts are located in cavities in the extracellular space of the cartilage, the lucanae. They will also be differentiating into the chondrocytes that we already know about.

Growth – There seems to be two types of growth, interstitial and appositional

  • Interstitial growth – Chondroblasts within the existing cartilage divide and form small groups of cells, isogenous groups, which produce matrix to become separated from each other by a thin partition of matrix. Interstitial growth occurs mainly in immature cartilage.
  • Appositional growth – Mesenchymal cells surrounding the cartilage in the deep part of the perichondrium (or the chondrogenic layer) differentiate into chondroblasts. Appositional growth occurs also in mature cartilage.

Something interesting that is noted is that the chondrocytes have rough endoplasmatic reticulum which decreases as the immature chondroblasts differentiate into the mature chondrocytes.

Different areas in the cartilage intercellular matrix – There seems to be actually two types of areas in cartilage, territorial and interterritorial matrix. The territorial matrix is located close to the isogenous groups of chondrocytes, which contains larger amounts and different types of glycosaminoglycans.

2 other important things to note:

  1. Fresh cartilage contains about 75% water which forms a gel with the components of the ground substance.
  2. Cartilage is nourished by diffusion of gases and nutrients through this gel.

Interestingly, the professor asks in this PDF for the students to “Think about how the spatial arrangement of chondrocytes in the isogenous group may reflect patterns of cell divisions.”

Elastic Cartilage

  • occurs in the epiglottic cartilage, the corniculate and cuneiform cartilage of the larynx, the cartilage of the external ear and the auditory tube.
  • corresponds histologically to hyaline cartilage, but, in addition, elastic cartilage contains a dense network of delicately branched elastic fibres.

Fibrous Cartilage

  • is a form of connective tissue transitional between dense connective tissue and hyaline cartilage. Chondrocytes may lie singly or in pairs, but most often they form short rows between dense bundles of collagen fibres. In contrast to other cartilage types, collagen type I is dominant in fibrous cartilage.
  • is typically found in relation to joints (forming intra-articular lips, discs and menisci) and is the main component of the intervertebral discs.
  • merges imperceptibly into the neighbouring tissues, typically tendons or articular hyaline cartilage. It is difficult to define the perichondrium because of the fibrous appearance of the cartilage and the gradual transition to surrounding tissue types.

Articular Cartilage

  • is a specialised form of hyaline cartilage.
  • transforms the articulating ends of the bones into lubricated, wear-proof, slightly compressible surfaces, which exhibit very little friction.
  • is not surrounded by a perichondrium and is partly vascularised.
  • is, depending on the arrangement of chondrocytes and collagenous fibres, divided into several zones:
    Tangential layer
    Chondrocytes are rather small and flattened parallel to the surface. The most superficial part (lamina splendens) is devoid of cells. Collagen fibres in the matrix of the tangential layer are very fine. They run parallel to the surface of the cartilage.Similar to the collagen fibres of the skin, the general orientation of collagen fibres in articular cartilage is determined by tensile and compressive forces at the articulating surfaces.

    Transitional zone
    The chondrocytes are slightly larger, are round and occur both singly and in isogenous groups. Collagen fibres take an oblique course through the matrix of the transitional zone.
    Radial zone
    Fairly large chondrocytes form radial columns, i.e. the stacks of cells are oriented perpendicular to the articulating surface. The course of the collagen fibres follows the orientation of the chondrocyte columns.
    Calcified cartilage layer
    It rests on the underlying cortex of the bone. The matrix of the calcified cartilage layer stains slightly darker (H&E) than the matrix of the other layers.

The main source of nourishment for articular cartilage is the synovial fluid, which fills the joint cavity. Additional small amounts of nutrients are derived from blood vessels that course through the calcified cartilage close to the bone.

Degeneration and Regeneration of Cartilage

Due to the fairly poor access of nutrients to the chondrocytes they may atrophy in deep parts of thick cartilage. Water content decreases and small cavities arise in the matrix, which often leads to the calcification of the cartilage. This further compromises nutrition. The chondrocytes may eventually die, and the cartilage is gradually transformed into bone.

Chondrogenic activity of the perichondrium is limited to the period of active growth before adulthood. Although chondrocytes are able to produce matrix components throughout life, their production can not keep pace with the repair requirements after acute damage to hyaline or articular cartilage. If these cartilages are injured after the period of active growth, the defects are usually filled by connective tissue or fibrous cartilage. The extracellular matrix of these “repair tissues” is only poorly integrated with the matrix of the damaged cartilage.

Fortunately, cartilage is rather well suited for transplantation – the metabolism of the chondrocytes is rather slow, the antigenic power of cartilage is low, and it is difficult, if not impossible, for antibodies or cells of the immune system to diffuse through the matrix into the cartilage.

From Source #2:

Cartilage Chart


An Analysis Of Ganoid Scales And Ganion, An Enamel Hard Like Substance Of Giant Sturgeons And Aligator Gars

This is one of those post which I try to take a relatively unknown concept and show how we would apply the principles of them to our height increase research. As I was watching the hugely popular show River Monsters last night, Jeremy wade started talking about how hard the outer skin or scales are of aligator gar. It seems that the aligator gar has a type of external layer of covering which makes it nearly impenetrable from the teeth and claws of other creatures. This type of scale like element is known as ganoid scales and ganoin. This ganoin material is supposed to be as hard as teeth enamel, and the properties of teeth enamel are that they have 3-5 times the strength as even our cortical bone. Teeth Enamel is very hard. The scales of these fish are just as hard. Native americans used the scales for hunting since the scales were that strong and tough.

Something that is known about sturgeons and gar are that they are very ancient creatures, which supposedly were around even when the dinosaurs were around. This means that as a species they are very tough and resilent, and somehow managed to survive whatever epidemic killed off the dinosaurs. I would guess that one of the reasons why the gar or sturgeon has been succesfull in terms of evolution is their scales, which makes them very hard to chew on. Injuries on gar and sturgeon would be very rare.

Gar Ganoid ScaleHowever, the thing which is interesting is that the sturgeon like the gar can grow to immense sizes. There are reports from centuries back when European settlers first came that sturgeons could grow to be over 20 feet long and gar was growing up to 16 feet tall. These days those sizes don’t seem to be showing up. However, let’s just assume that the reportings of giant sized fish were true.

Fish in general never stop growing, even in the adult stages. They have along with reptiles something known as indeterminate growth. Their growth is slower when they reached sexual maturity but their length continues.

If the species of gar and sturgeon can grow so much and so big, we must wonder how do they do it fi they are covered in such hard and rigid material like ganoin. How do the ganoid scales stretch out and accomodate the fish who is growing?

It seems that the key is that the scales are not connected together by the tough enamel like ganoin, but the boundary that scales intersect at is flexible. This area is where the gar can push and expand at.

From what I remember from my old days in fishing, most fish that I caught, which were sunfish had  a vertebrate which I would call very flexible and cartilagenous. For sharks, they have no real “bones” like what mammals have. Their backbones are cartilage actually.

Implications For Height Increase

The ganoin that is on the top of the ganoid scales in these fish should have kept the fish from growing. They are as strong as human teeth enamel. Even the cartilage bones of the fish backbone would never be able to expand and hypertrophy enough to push the scales apart if the scales were really fused together at the intersecting boundaries. I am proposing that the reason fish like gar with such touch skin can grow is that their external surface covered in actual bone can stil expand because the hard bone is embedded with a pattern of none ganoin to push the whole fish out.

The cartilage does play the role of cartilage growth, but the bone would have stopped the fish from getting longer. The way for this type of fish, the gar, to grow so long is not just that they live as a very long life (which they do), and not just because they experience indeterminate growth (which most fish do), bu that the bones around their body is not completely enveloping them.

What I am proposing is that maybe at some point in the next few years, we find out what is the material that is between the scales of fish like gar. Is it collagen? cartilage? skin tissue?

This material does not go through the type of ossification process we see in humans. Why doesn’t it?

In human physiology theory, any area between two bone segments that are so close together would eventually experience vascularization, calcification, and eventual ossification. The gar with its bone body somehow has a way to prevent that tissue in the middle part to never ossify. That is what I want to study further.

The Measurements And Mechanical Properties Of The Adult Human Femoral Bone

This Ph.D Thesis & Dissertation was interesting because it seems to talk about the mechanical properties of the human femoral bone, which has been something that I and some other height increase researchers have been searching for a long.

Ph. D Thesis: The Distribution and Importance of Cortical Thickness in Femoral Neck and Femoral Shaft and Hip Fracture and Lower Limb Fracture – Author: Fjóla Jóhannesdóttir

I wanted to list a few parts of the thesis which will help us gain a better understanding on the physiology of the adult human femoral bone

Bone Biology, Introduction 2.1 – Bone require mechanical stress in order to grow and strengthen therefore physical activity is important to develop and maintain bone strength.

2.2 Structure of Bone – The composition of bone is more complex than most engineering composites as there is no level of organization at which one can truly be said to be looking at bone as such.

2.2.1 Composition of bone – Bone is composed of 65% (by weight) mineral (inorganic phase) and 35 % organic matrix (consist of 90% collagen and 10% of various noncollagenous proteins), cells and water (Jee 2001).

  • Composition of Bone Continued – The bone mineral is in the form of small crystal in the shape of needles, plate, and rods located within and between collagen fibers. The mineral is largely an impure form of naturally occurring calcium phosphate, most often referred to as hydroxyapatite Ca10(PO4)6(OH)2
  • Calcium compounds provide stiffness and strength but collagens provide ductility and toughness (Currey 2003).
  • During growth, the amount of organic matrix per unit volume remains relatively constant, while the amount of water decreases and the proportion of bone mineral increases. The reduction of water content results in a stiffer bone in adults than in children.

2.2.2 Bone cells – The major cellular elements of bone include osteoclasts, osteoblasts, osteocytes and bonelining cells.

  • Osteocytes – are the principal cell type in mature bone and derived from osteoblasts. They are embedded into bone matrix, residing in lacunae and communicate with neighbouring osteocytes and with osteoblasts and bone lining cells by means of processes that are housed in little channels (canaliculi)….Aging, loss of estrogen, loading, and chronic glucocorticoid administration is known to increase osteocyte death (Noble and Reeve 2000).
  • Osteoclasts – …Actively resorbing osteoclasts are usually found in cavities on bone surfaces, called resorption cavities. When osteoclasts have done their job they disappear and presumably die. The osteoclasts possesses receptors for calcitonin and responds to parathyroid hormones, 1,25(OH)2, vitamin D3 and calcitonin. Bisphosphonates, calcitonin and estrogen are commonly used to inhibit resorption and are believed to act by inhibiting the formation and activity of osteoclasts and promoting osteoclast death

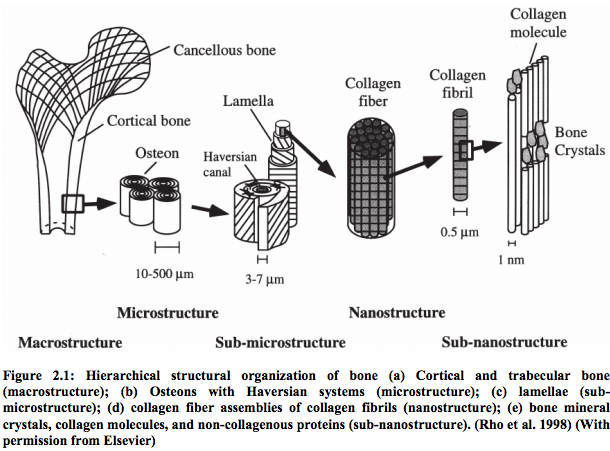
2.2.3Hierarchical Levels of Bone (from lowest to highest)

Note: Human bones have an irregular arrangement and orientation of the components, making the material of bone heterogeneous and anisotropic.

  • Sub-nanostructure – a molecular structure of constituent elements, such as mineral, collagen and non-collagenous organic proteins
  • Nanostructure – a composite of mineralized collagen fibrils
  • Sub-microstructure – the fibrils are arranged in two forms, woven bone and lamellar bone.

Woven Bone

  1. is characterized by irregular organization of collagen fibers
  2. is mechanically weak
  3. usually laid down very quickly
  4. found in situations of rapid growth in children and during initial stages of bone fracture healing

Lamellar bone

  1. is more precisely arranged.
  2. The collagen fibrils and their associated mineral are stacked in thin sheets called lamellae (3-7µm wide) that contain unidirectional fibrils in alternate angles between layers.
  3. Lamellar bone is most common
  4. can take various forms at next level (microstructure).
  5. Primary lamellar bone is new bone that consists of large concentric rings of lamellae
  • Macrostructure –  there are two types of bone, cortical bone and trabecular bone (aka cancellous bone)

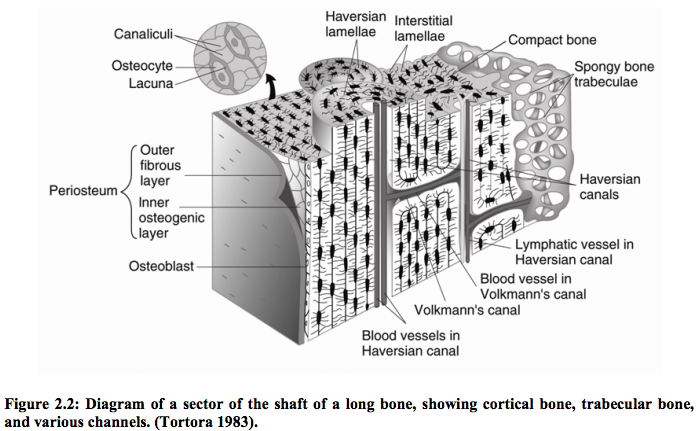
1. Cortical bone – is made of Haversian systems (aka osteons)

The most common type of cortical bone in adult human is called osteonal (aka Haversian bone)

Haversian bone

  • contains blood vessel capillaries
  • nerves
  • a variety of bone cells.

The substructure of concentric lamellae, including the Haversian canal, is termed an osteon. It looks like a cylinder.

Other channels

  • Volkmanns’s canals – run perpendicular to the Haversian canals providing radial paths for blood vessels.

2. Trabecular bone 

  • a highly porous cellular solid
  • the lamellae are arranged in an interconnecting framework of trabeculae in a form a series of rods and plates

The picture below is taken from Page 5 if the Ph. D Thesis, which seems to have been taken from Elsevier

Bone Stucture


2.2.4 – Cortical & Trabecular Bone

Trabecular Bone

  • is much more porous with 50-90% porosity and is usually found at the ends of long bones
  • in cuboidal bones and flat bones like the pelvis
  • overall matrix forms an open network of trabeculae (interconnecting rods or plates of bone) and spaces are filled with marrow.
  • are oriented along stress lines and the surface covered with endosteum.
  • have no blood vessels and the canaliculi are opening on surface and nutrition are transmitted through them.

Cortical Bone

  • is solid, with only spaces in it being for osteocytes, canaliculi, blood vessels and erosion cavities.
  • It is much more dense and stronger than trabecular bone with 5-10% porosity.
  • Approximately 80% of the skeletal mass in the adult human skeleton is cortical bone.
  • It is primarily found in the shaft of long bones and forms the out shell around trabecular bone at
  • the end of joints and the vertebrae

Bone Composition Diagram


2.3 – Bone Modelling & Remodelling

Ossification and skeletal growth require two essential processes, 1. bone modelling and
2. bone remodelling.

Bone Modelling

  • consists of changes in bone shape and size to allow growth and adaptation to mechanical loading (Seeman 2009).
  • Bone may be added to or removed from the periosteal and endosteal surfaces

Bone Remodelling

  • old bone is removed under the signal delivered by damaged osteocytes and replaced with the same amount of bone in the same site of previous removal (Seeman 2009).
  • is a balanced process – bone resorption and bone formation must equilibrate to prevent dysfunctions otherwise seen in bone diseases…

Frost´s mechanostat theory

  • presents the relationship between bone formation, bone remodelling and the mechanical stimuli.  
  • describes a window of mechanical usage which is considered physiological and maintains the bone in homeostasis.

3.1 – Bone Strength Introduction

Bone has a number of mechanical properties and they can be described by…

  1. a load-deformation curve
  2. stress-strain curve
  • Structural Behavior – the mechanical behaviour of a whole bone as a structure
  • Material Behavior – the mechanical behaviour of the bone tissue

Load-deformation curve

  • describes the relationship between load applied to a structure and deformation in response to the load and reflects the structural behaviour of the bone.
  • the shape of this curve depends on both morphology and the material properties of the structure.
  • The slope of the elastic region of the load-deformation curve represents the extrinsic stiffness of rigidity of the structure.
  • Several other biomechanical properties can be derived including…1. ultimate load (failure load), 2. work to failure (area under the load-deformation curve), 3. ultimate deformation.

Stress-strain curve

  • is analogous to the load-deformation curve but reflects the material behaviour of the bone that is independent of the geometry of the test specimen from which the properties were measured and it reflects the intrinsic properties of the material.
  • The slope of the stress-strain curve within the elastic region is called the elastic or Young’s
  • modulus that is a measure of the intrinsic stiffness of the material.
  • The values of stress and strain at the ultimate point are ultimate stress and ultimate strain.
  • The area under the stress-strain curve is a measure of the amount of energy needed to cause a fracture and is a measure of the toughness of the specimen.
  • The elastic region and the plastic strain region of the stress-strain curve are separated by the yield point.
  • Before the yield point, the bone is considered to be in the elastic region, and if unloaded, would return to its original shape with no residual deformation.
  • In the post-yield region the stresses begin to cause permanent damage to bone structure.
  • Post-yield strains represent permanent deformations of bone structure caused by slip at cement lines, trabecular microfracture, crack growth, or combinations of these

3.2 The Components that contribute to bone strength

Remember: The mechanical behaviour of a whole bone depends on…

  1. the morphology of the bone
  2. the intrinsic properties of the bone material itself. 

Implication: Thus, properties at the cellular, matrix, microarchitectural and macroarchitectural levels may all impact bone mechanical properties

The factors that contribute to bone strength

  1. Bone morphology: Size, Shape (distribution of bone mass), Microarchitecture (trabecular architecture, cortical porosity/thickness) 
  2. Bone tissue material properties: Density, degree of mineralization, extent of microdamage, collagen traits 
  3. Bone turnover (Bone remodelling)

3.3 – Mechanical Properties Of Bone

  • Bone is an anisotropic material – its mechanical properties are dependent upon direction of loading, leading in general to greater compressive strength than tensile strength.
  • Bone exhibits viscoelastic behaviour – the elastic modulus and the strength of the bone are dependent on strain rate.
  • Bone stiffness increases with increasing strain rate
  • Ductility decreases with increasing strain rate.
  • Material properties of bone, particularly stiffness and strength, are strongly dependent on the volume fraction and density.
  • Cortical bone can withstand much greater load than trabecular bone but will not deform much before failure.
  • Trabecular bone can deform significantly, but will fail at a much lower load.

The Cortical Bone – Mechanical Properties

  • Cortical bone is both stronger and stiffer when loaded in the longitudinal direction
  • compared with transverse plane because of the nature of the arrangement of the osteons
  • Unlike the ultimate stresses, which are higher in compression, ultimate strains are higher in tension for longitudinal loading.
  • In contrast to its longitudinal tensile behaviour, cortical bone is relatively brittle in tension for transverse loading and brittle in compression for all loading directions.
  • Cortical bone is weakest when loaded transversely in tension and is also weak in shear.
  • The mechanical properties of cortical bone are heavily dependent on porosity and degree of mineralization.
  • More than 80% of the variation in the elastic modulus of cortical bone can be explained by a power-law relationship, matrix mineralization and porosity as explanatory variables.
  • Cortical porosity can vary from less than 5% to 30% and is positively correlated with age.
  • Thus, cortical bone properties for specific individuals depend on porosity.

The Trabecular Bone – Mechanical Properties

  • elastic modulus can vary 100-fold even within the same metaphysis and with varying degree‘s of anisotropy
  • mechanical properties should be accompanied by specifications of factors such as anatomic site, loading direction and age.
  • the most important microstructural parameter for trabecular bone is its apparent density since the properties are often defined as a function of apparent density.
  • Power-law relationships with bone density as the explanatory variable explain 60% to 90% of the variation in the modulus and strength of trabecular bone
  • These power-law relationships indicate that small changes in apparent density can lead to dramatic changes in mechanical behaviour.
  • it is important as stiffening the structure by holding together the shell, prevent buckling, support cortical bone in case of impact loads and distributes loads at extremities.

More Information About the Mechanical Properties of The Adult Human Femoral Bone

  • while elastic modulus of cortical bone decreases modestly with aging, the strength and especially the toughness decrease more substantially
  • In human cortical bone from the femoral mid-diaphysis, the tensile and compressive strengths decrease about 2% per decade
  • While the toughness (energy to fracture) declines by 5-12% per decade, indicating that cortical bone becomes more brittle and less tough with increasing age
  • These changes in the mechanical properties of cortical bone are mainly caused by the increase in porosity with age
  • Other additional possible causes of the age-related deterioration of bone strength include changes in mineral crystal and collagen
  • The elastic modulus and ultimate strength of trabecular bone decrease with age in both men and women as a consequence of markedly decrease in the apparent density
  • The decreased strength of trabecular bone is also because of deterioration of trabecular architecture.
  • Microdamage is another age-related change at both the cortical and trabecular tissue level which may contribute to bone strength
  • As people grow older, the endocortical and intracortical remodelling increase resulting in that cortical bone becomes more porous and the cortex thinner
  • As endosteal bone loss proceeds the periosteal apposition takes place that is an adaptation to maintain whole bone strength, increasing the cross-sectional area of bone to reduce the load/unit area (stress) on the bone and increase its resistance to bending and torsion

 4.3 Whole bone strength of proximal end of femur in vivo

No notes were copied from the Ph. D for this section

Analysis

When I first started reading over this rather short Ph. D thesis I was expecting that the Ph. D. candidate would at least mention what the values and measurements for the mechanical properties of the human femur bone would be. It seems that after going over the thesis, I was unable to find any information on what I was really looking for. However, the thesis was a good read to review and refresh my memory on the elements and composition of bones in general.

The study was to show how changes in strength of the aging human proximal femoral neck would be. They were looking at how falls on the sides of elderly would result in fractures in the femoral neck area and hip fractures. They noticed that for women, nearly all the factors and parameters that determine bone strength decreased. Brittleness increased and area increased to compensate for increased bone porosity.

The researchers stated “We did not have an estimate of BMD or porosity in the femoral shaft cortex”


The Connection Between Bone Loss From Osteoporosis And Decreases In Height In East Asian Females

Usefulness of Estimated Height Loss for Detection of Osteoporosis in Women

J Korean Acad Nurs. 2011 Dec;41(6):758-767. English.
Published online 2011 December 31.  http://dx.doi.org/10.4040/jkan.2011.41.6.758

© 2011 Korean Society of Nursing Science

Usefulness of Estimated Height Loss for Detection of Osteoporosis in Women

Soon Gyo Yeoum,1 and Jong Hwa Lee2

1Associate Professor, Department of Nursing, Seoil University, Seoul, Korea.

2Full-time Lecturer, Department of Nursing, Kunsan College of Nursing, Gunsan, Korea.

Address reprint requests to: Yeoum, Soon Gyo. Department of Nursing, Seoil University, Seoildaehak-gill 22, Jungrang-gu, Seoul 131-702, Korea. Tel: +82-2-490-7580, FAX: +82-2-490-7555, Email:yeoumsg@seoil.ac.kr

Received May 30, 2011; Revised June 04, 2011; Accepted December 09, 2011.

Abstract

Purpose

This study was done to examine the threshold value of estimated height loss at which the risk of osteoporosis increases and to verify its discriminative ability in the detection of osteoporosis.

Methods

It was conducted based on epidemiological descriptive methods on 732 Korean women at a public healthcare center in Seoul between July and November 2010. ANOVA, Pearson correlation, logistic regression analysis and receiver operating characteristics (ROC) curve were used for data analysis.

Results

There was an age-related correlation between bone mineral density (lumbar spine: F=37.88, p<.001; femur: F=54.27, p<.001) and estimated height loss (F=27.68, p<.001). Estimated height loss increased significantly with decreasing bone mineral density (lumbar spine: r=-.23, p<.001; femur: r=-.34, p<.001). The odds ratio for the point at which the estimated height loss affects the occurrence of osteoporosis was found to increase at a cut-off value of 2 cm and the area under ROC curve was .71 and .82 in lumbar spine and femur, respectively.

Conclusion

The optimal cut-off value of the estimated height loss for detection of osteoporosis was 2 cm. Height loss is therefore a useful indicator for the self-assessment and prognosis of osteoporosis.


Analysis & Interpretation

This may be the first type of evidence that I have found which shows that decrease bone mineral density leads to height loss. The type of subjects this experiment was tested on were East Asian/Korean adult females. Something that is well known is that East Asian females as a demographic suffer one of the highest rates of bone mineral loss. This means that Korean females have a very high risk of osteoporosis as they get older. The decreased height from bone density loss is very surprising.

We know that as people get older, the bone density level decreases in their bones. We also see the correlation between older age and height loss. People tend to loss at least around 1 inch of height for each decade that passes after their 40s. This report shows that for at least Korean females, maybe the reason they loss height is because they loss bone density. After the height loss reaches 2 cm, the chance of developing osteoporosis sharply rises.

This case is interesting since it shows a direct correlation to decreased bone density and height loss. It makes the height increase researcher wonder whether opposite might be right as well. if we increased bone mineral density in adult humans from taking bone growth pills like station, would that lead to increased height? That is something to think about.

Something that would be obvious is that to prevent such a high rate of height loss and stay around the same height even into later life for East Asian females, they would have to look for ways to keep the bone density at a reasonably healthy level.

The Connection Between Vascular Endothelial Growth Factor, VEGF And Growth Plate Senescence And Closure

From book “Regulators of Growth Plate Maturation” Chapter 11

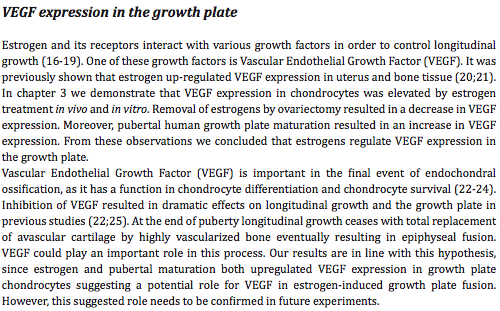
VEGF expression


We already know that estrogen and it receptors interact with growth factors to control longitudinal growth. one of the growth factors is called Vascular Endothelial Growth Factor, VEGF. The Estrogen seems to upregulate the VEGF in bone tissue. In a previous section, it was said that both in vitro and vivo the administration of estrogen upregulated the concentration of VEGF. If the ovaries are removed, estrogen decreases by a huge amount and VEGF expression decreases. In addition growth plate maturation coincides with an increase in VEGF expression.

It is concluded that VEGF has a important role when endochondral ossification is close to finishing. If we can inhibit the VEGF expression then we can increase the longitudinal growth of the growth plates.