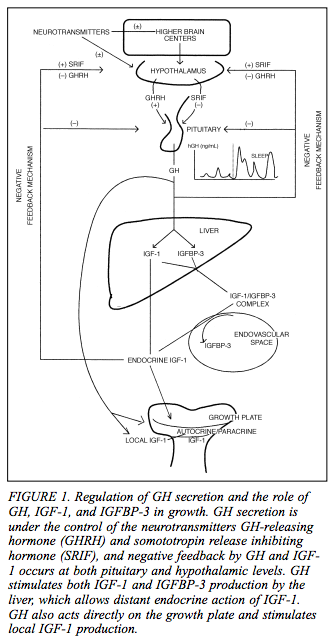
I was doing more research and I found this rather lovely graphical representation of the basic theoretical model on how the general growth hormones like GH and IGF are linked to accelerate and deccelerate the growth process. The source of the picture where it was taken from was from BCM on their website HERE
As you can see there appears to be two main negative feedback mechanisms causing and telling the hypothalamus to decrease the release of the growth hormone releasing hormone and increase somatotropin release inhibiting hormone. Ordinarily the hypothalamus would be releasing more GHRH and using less SRIF when the person is growing.
Overall there is actually 4 negative feedback mechanisms (but two mains ones). As you can see from the smaller graph, the GH release rate is far higher during sleep than waking periods. So kids, sleep more if you want to increase the growth rate.
What is surprising for me is that the GH seems to get to the IGFBP-3 as well as IGF-1 . Somehow I forgot that you need a binding protein to work on the actual protein.
The other odd thing from the diagram is that it suggests that there may be actually something else controlling the hypothalamus, which the graph termed “higher brain centers” which seems to be releasing neurotransmitters to the hypothalamus. What type of neurotransmitters is not stated in the document.
From the article…
Recently, a new class of orally active GH-secreting compounds (peptidyl and nonpeptidyl GH secretagogues) have been developed. GH secretagogue receptors are located in the hypothalamus
and pituitary. Their endogenous ligand, although not yet identified, may be part of a novel neuroendocrine system in the regulation of GH secretion.
Me: so there are more than just the old GHRH and SRIF controlling the release the release of GH, but now there is discovered the GH secretagogues
From the article…
IGFs influence fetal growth independently of GH. IGFBP-3 is highly GH dependent, and its circulating concentrations correlate closely with GH secretory status. Circulating concentrations of both IGF-1 and
IGFBP-3 are low during the first 5 years of life; they slowly increase to peak concentrations during ado-lescence. Both circulating concentrations and the biologic actions of IGF-1 are regulated closely by GH, but they also are influenced by malnutrition, chronic renal and liver disease, and hypothyroidism
Me: I know that IGF indeed influence fetal growth independent of GH. I did not know that IGFBP-3 is dependent on release rate of GH. It does seem that postnatally, the IGF influence on growth does become affected by GH. In addition, the GH can skip the liver production of IGF-1 stage and go directly to the growth plates and just start producing IGF-1 in the local zone.
I hope this visual diagram helped some people get a better overall picture of the basic endocrinology steps going on the growth development.


Pingback: Complete List Of Posts - |