 This post is really for the concerned and worried parents out there who might be interested in knowing just how fast their son or daughter should be growing at the age that they are at.
Note: This post is also a key post which will be used to show that if I propose a technique or method for increasing the growth rate of a person who still has open epiphyseal growth plates, for the serious, sceptical, cynical person to see that there is a high reasonable percentage of a chance that the technique probably did do what I had said it would.
All that would need to be done is to compare the average rate of height increase for the time period of a person from say a medical textbook chart to the increases seen from implementing a technique or idea I propose.
First, I would like to cite the Wikipedia article on “Growth Chart” which has a link to the World Health Organization website. There is a link to a PDF entitled “WHO Child Growth Standards” from the www.who.int/ website. This massive book is over 300 pages long so I clearly will not try to read the entire PDF.
Analysis #1: For the WHO child growth standards
I would like to refer the reader to pages to 3 main sections of the PDF
- pages 32-33 which talks about the growth of boys
- pages 59-60 which talks about the growth of girls
- pages 74-77 which compare the growth of girls to boys.
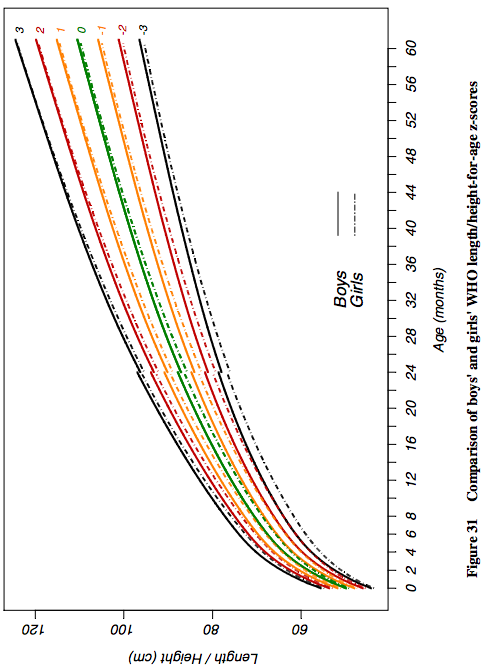 There are charts for all of the three sections. what is interesting is that in this World Health Organization PDF they are comparing the numbers and measurements of the WHO to also the CDC and the NCHS. The study only is looking at the growth rate of very young kids. between the 0-60 months years old group. As we can see from the chart pic on the left there is a non-linear growth pattern for young children between the ages of 0-5 years old. If we look at another picture looking at the growth rate progression of people in general from ages 0 until the ends of puberty, ages 0-22, we see that the entire growth progression chart is also nonlinear.
The graphs like the one (taken from the section 74-77) to the left all show for a y->x axis chart looking at measured height to determined age, in units of cm to months. For the page section comparing the growth of girls to boys, you can see that the heights are all slightly lower for girls compared to boys. This is expected since humans when comparing the sex have a sort of dimorphic distribution of height where the girls and boy height are always diverged apart from each other, but don’t seem to ever converge in the middle.
Note #1: As it is well known, for each different demographic, ethnic group, or nation the growth rate and final adult height of a subset of the entire human population will be different from another. This means that the final numbers or the chart that might be posted at the end of this post will almost always be slightly off from what a real parent would see. What the growth/ height increase progression rate of a child will be different in Vietnam compared to say the Netherlands.
So what does the small chart I have copy and pasted from page 75 actually show about the growth progression in young children from young age, specifically ages 0-5 years old?
If we take a ruler and tried to measure the magnitude of the difference of the y axis versus each year we see that for the first year of life, the growth is the strongest (months 0-12) with going about 40-> 75 cms, a 25 cms increase, which is exactly 1 entire feet in growth. For the 2nd year for average (50 percentile) boys they go from 75 –>90 cm, which is a 15 increase, or 6 inches. For the 3rd year they increase from 90–>97 cm, or a 3 inch increase. This continuation in decrease of growth rate is seen in the 4th and 5th year too. For the issue with girls, they seem to start at about 5 cm shorter than boys at birth and but have a similar growth pattern trend, if not a little less steep growth trend in the first 2-3 years. Since the graph does not continue on for ages 6-18, I had to resort to another graph and other resources to find out just how much a child should grow in later years when their epiphyseal plates are still open.
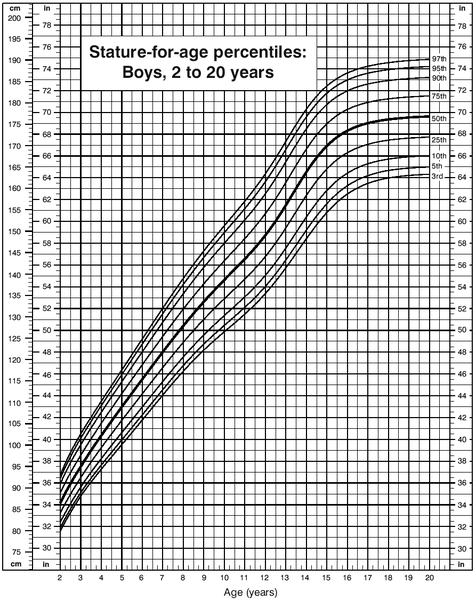
When I try to type in the phrase “growth progression chart” into google what I mostly get are charts for very young children, babies and infants in the 0-5 year range. Most of the image results reveal the two charts (for boys and girls) belows
Before we look at the charts for the average height growth progression I would like to cite a few PubMed articles.
The first is “Evaluation of growth rate in height over periods of less than one year”
Abstract
The stature of 260 well-nourished children aged between 7 and 10 years was measured at intervals of approximately 1 month over 13 months. The growth rate of each child was calculated over periods of 3 months and 6 months ending in each month of the year. Children who missed one or more measurements, due to absence from school, were excluded from the calculations
Centiles of growth rate for these periods are presented. A growth rate of 3-4 cm/yr is well within normal limits for a period of 3 or 6 months ending in December or January, but is below the 10th centile for periods ending between March and June.
Most children reach their maximal 3-monthly rates in the periods of either 3 or 6 months ending between March and July, and their slowest in the periods ending between September and February.
A child’s growth rate over the 3 months of fastest growth is most frequently 2 to 3 times his slowest rate, but may be 7 or more times the slowest if the latter was very low. There may be no measurable growth during a single period of 3 months in a normal child, but maximal rates of up to 10 cm/yr are not necessarily abnormal. An individual’s maximal 6-monthly rate may be up to 3 times his minimal.
A satisfactory assessment of a child’s growth cannot be made over a period of less than one year.
The 2nd study cited is “[WHO growth standards for infants and young children].” which was written in 2009 in French
Abstract
The growth pattern of healthy breastfed infants deviates to a significant extent from the NCHS/WHO international reference. In particular, this reference is inadequate because it is based on predominantly formula-fed infants, as are most national growth charts in use today. The WHO multicentre growth reference study (MGRS), aimed at describing the growth of healthy breastfed infants living in good hygiene conditions, was conducted between 1997 and 2003 in 6 countries from diverse geographical regions: Brazil, Ghana, India, Norway, Oman and the United States. The study combined a longitudinal follow-up of 882 infants from birth to 24 months with a cross-sectional component of 6669 children aged 18-71 months. In the longitudinal follow-up study, mothers and newborns were enrolled at birth and visited at home a total of 21 times at weeks 1, 2, 4 and 6; monthly from 2-12 months; and bimonthly in the 2nd year. The study populations lived in socioeconomic conditions favorable to growth. The individual inclusion criteria for the longitudinal component were: no known health or environmental constraints to growth, mothers willing to follow MGRS feeding recommendations (i.e., exclusive or predominant breastfeeding for at least 4 months, introduction of complementary foods by 6 months of age and continued breastfeeding to at least 12 months of age), no maternal smoking before and after delivery, single-term birth and absence of significant morbidity. Term low-birth-weight infants were not excluded. The eligibility criteria for the cross-sectional component were the same as those for the longitudinal component with the exception of infant feeding practices. A minimum of 3 months of any breastfeeding was required for participants in the study’s cross-sectional component. Weight-for-age, length/height-for-age, weight-for-length/height and body mass index-for-age percentile and Z-score values were generated for boys and girls aged 0-60 months. The full set of tables and charts is presented on the WHO website (www.who.int/childgrowth/en), together with tools such as software and training materials that facilitate their application. The WHO child growth standards were derived from children who were raised in environments that minimized constraints to growth, such as poor diets and infection. In addition, their mothers followed healthy practices such as breastfeeding their children and not smoking during and after pregnancy. The standards depict normal human growth under optimal environmental conditions and can be used to assess children everywhere, regardless of ethnicity, socioeconomic status and type of feeding. The standards explicitly identify breastfeeding as the biological norm and establish the breastfed child as the normative model for growth and development. They have the potential to significantly strengthen health policies and public support for breastfeeding. The pooled sample from the 6 participating countries allowed the development of a truly international reference that underscores the fact that child populations grow similarly across the world’s major regions when their health and care needs are met. It also provides a tool that is timely and appropriate for the ethnic diversity seen within countries and the evolution toward increasingly multiracial societies in the Americas and Europe as elsewhere in the world. The WHO standards provide a better tool to monitor the rapid and changing rate of growth in early infancy. They also demonstrate that healthy children from around the world who are raised in healthy environments and follow recommended feeding practices have strikingly similar patterns of growth.
The 3rd PubMed article cited is “New growth standards for the 21st century: a prescriptive approach.”
Abstract
Breast-fed babies have been shown to grow at a substantially different rate from the current international reference curves, with greater growth rates in height but with smaller body weight increases and substantially less variability in the growth patterns of a group. On this basis, the World Health Organization concluded that there was a need to undertake new studies to establish on a global basis the appropriate growth curves for exclusively breast-fed babies, their growth curves then being potentially seen as optimum standard curves rather than an arbitrary set of reference charts. The Multi-Country Growth Reference Study was therefore carried out from July 1997 to December 2003 as a population-based study covering the cities of Davis, California, USA; Muscat, Oman; Oslo, Norway; and Pelotas, Brazil, together with selected affluent neighborhoods of Accra, Ghana and South Delhi, India. These centers were considered conducive to a study of babies and children under optimum breast-feeding and weaning and early feeding conditions. These studies, to be reported shortly, confirm previous observations on breast-fed children, but also show that the greatest differences are within each population group rather than being international differences.
The last study or article I would like to cite is written by Dr. Robert H. Shmerling entitled “Can We Predict Height?“. A part of the article he wrote is copy and pasted below…
What Determines Height?
One’s ultimate height is determined by a complex interaction of many factors including nutrition, genes, and overall health. Growth rates vary over a lifetime:
- From infancy, when average length is 20 inches, to age 2 there is initially rapid growth, then slowing, with about 14 inches in height added.
- From age 2 to puberty there is slow, steady growth at about 2½ inches per year.
- As one enters puberty, a growth spurt of 3 to 5 inches in a year is common.
- By ages 40 to 50, height actually may begin slowly to decline, even in healthy adults.
Final Conclusion & Analysis Made By Me
So what do the charts and numbers say about the growth rates in children or adolescent who still have open growth plates?
From the first pubmed studies we learn that for children at least in the age range of 7-12, their growth rate is far higher between the months of March and july than the other half of the year. The growth rate during the fastest 3 months can be as high as 7 times as fast as during their slowest time but is on average 3 times as fast as the slow months between december and february. Growth is usually 3-4 cm/year if one was only accounting the time of growth during the bad time range but can be as high as up to 10 cm/year
The 2nd pubmed study shows that if mothers decided to breastfeed their babies exclusively or more than just usual formula very quickly in the babies development, their height growth progression would be far more different. The modern nations have mothers feeding their babies formula much more now that this causes the World Health Organization height progression charts to be very off from what might be more “natural”. For the study, all the other factors which might make the issue of comparing breastfeeding vs formula to height progression was removed where the mothers were advised to continue to breatfeed beyond a certain month and to refrain from smoking and many other behavior to negate other factors which might make the data useless.
The 3rd pubmed study is written by the same authors so basically only validates the 2nd study. The growth charts for breast feed babies are very different from formula feed babies. The growth rate for the babies show higher height increase in terms of relative to the gain of weight. This implies that if the health organizations like WHO are hoping to get a far more natural and most accurate reference growth chart of babies from around the world, they need to put the babies on a breastfeeding diet for much more than their mothers might be doing currently.
The last resource I cited is from a doctor He states that from ages 0-2, the baby gains about 14-15 inches in height, which is about what the other chart indicated. For the age range of 2-13, or whenever puberty starts, the growth rate is about 2.5 inches per year. Puberty causes the growth rate to increase up to 3-5 inches per year.
So from all the resources I have found, but especially the WHO, CDC, and NCHS the amount of height increase is sort of like this
Age range
- 0-1 – 12 inches
- 1-2 – 5-6 inches
- 2-3 – 3 inches
- 3-4 – 2.5-3 inches
- 4-11 – 2.5 inches
- 11-13 – 3-5 inches
- 13-17 – 1.5-2 inches
- 17-18 – 1-1.5 inches
So the number values are based on averages but can still be used to compare one’s children’s growth rate to other kids their age to see if they are growing property and within the aceptable growth rate percentile.