Growth plate stress distribution implications during bone development: A simple framework computational approach.
“We found stress distribution during bone development established osteogenic index patterns that seem to influence locally epiphyseal structures growth and coincide with growth plate histological arrangement.”<-So how stress is applied to the growth plate affects longitudinal bone growth.
“Growth plate characteristics, such as location within the bone, morphology, and width, change according to bone type and age”
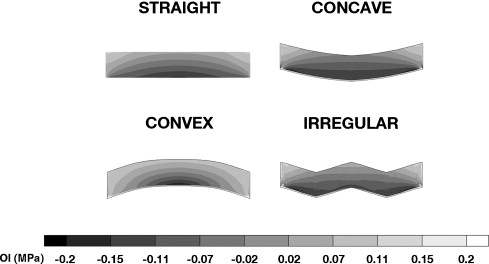
“the growth plate morphology of a proximal femoral epiphysis can resemble a concave meniscus at the age of four. With increasing age, at seven the growth plate becomes straight, as a ridged non-uniform line. Last, the growth plate assumes the form of an arch at the beginning of puberty”
“growth plate’s width changes through life, with a wider growth plate during early stages and diminishing progressively until its disappearance toward the end of adolescence”
“Stress distribution pattern for all simulations demonstrated peak octahedral normal stress (P) beneath the loading area. Furthermore, highest values for octahedral shear stress (S) were observed in the central zone of the epiphysis.”<-Load was 1 MPa and applied on the top of the epiphysis.
“high OI values predict cartilaginous tissue ossification”
LSJL growth plates became more convex in response to load.
“prior to complete epiphyseal ossification OI patterns coincide with growth plate histological organization (reserve, proliferative, hypertrophic) which may be involved in stimulating longitudinal bone growth. Additionally, it was observed that complete epiphyseal ossification has an impact on growth plate stress distribution favoring its maintenance rather than ossification.”
” Since long bone growth results from ossification within the growth plate, we suggest OI values in this structure can be an indicator of expected growth rate. Within the growth plate OI values were affected by all variables studied: localization, morphology, and width”
“we obtained a decreasing trend in OI values from the epiphyseal to the diaphyseal end of the growth plate. Our results evidenced OI peak values in the reserve zone, with OI values comparable to those observed in the epiphysis. The reserve zone is in charge of providing cells to the proliferative zone assuring growth process continuity. Moreover, it has been proposed that resting chondrocytes may synthesize biochemical factors, responsible for growth orientation and inhibition of hypertrophy in the proliferative zone. These events favor growth plate histological organization in distinct zones”
“octahedral normal stress has been reported to linearly increase chondrocyte membrane lipid packing and lipid desaturase gene expression”