Note: To see the report from last month, go to “Natural Height Growth November 2012 – Monthly Website Traffic Data Report.”
One of the features I wanted to add to this website was to show the readers how far and big the website has managed to reach from it’s birth. I have been using the website traffic tracking programs Google Analytics and Clicky to determine how much and what type of traffic has been going through the website. These days I mainly only use Clicky because it has some features that Google Analytics just don’t provide (ie. real time live streaming traffic data). It is not free once you use it past a certain number of days or add a certain number of websites. For 1 year of coverage, I paid about $90. I personally think it was worth the service just to know what my websites are up to.
For this month’s report, since it is the last month of the year, I will be posting a little more information than usual. I will show both the Monthly and Yearly traffic data.
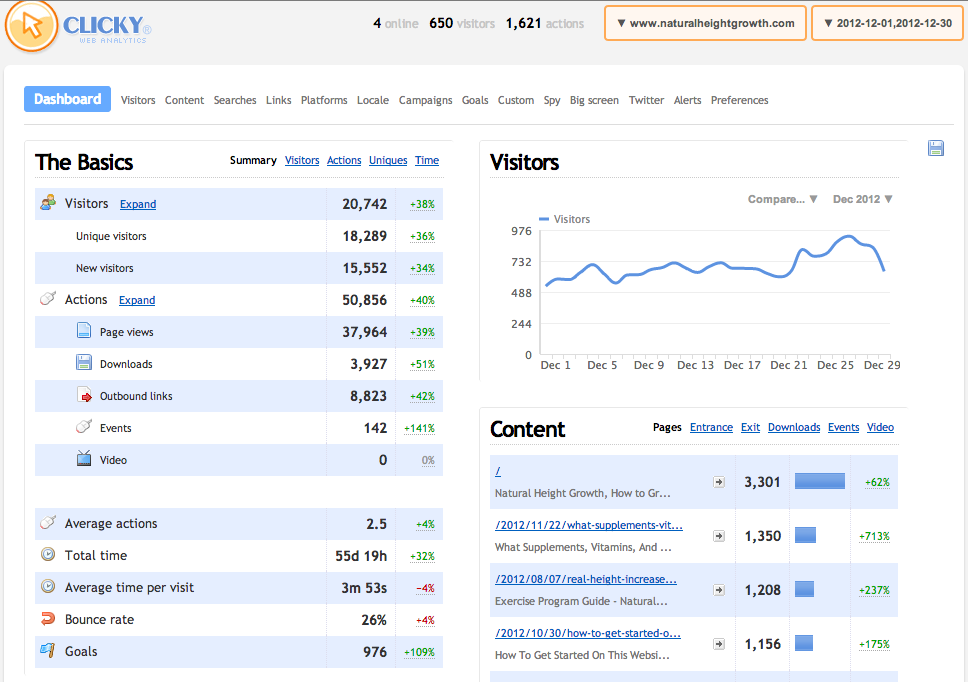
Analysis: If we now look at the data, we see that the daily visitors have increased from about 600 total visitors per day in November to about 800-850 total daily visitors per day in the last week or so. However there has been a 1 day where the traffic did go past the 900 visitors mark to around 930. At this rate, I hope that by next month the traffic will reach 1000 total daily visitors. What is been very consistent is the bounce rate, which has always been around the 24%-28% range. The average amount of time spent on the website is 3 min, 53 secs. Last month, the traffic was around 14,000 total visitors on the 30th. This month the traffic is 21,00o for the time to the 30th. This technically means that the traffic has increased by 50% from last month, which is about the same pattern we saw last month. The major website changes I did like add the supplement page and a complete formal exercise routine page, along with a “Start Here” page meant most of the traffic is going through those 3 pages now instead of just randomly ending up in the multiple pages. Like James/Hakker said in the last podcast episode, this website has many pages and it is very difficult to navigate around the place. I will have to figure out how to make the website easier to navigate around for next year.
For the month of December, from data range Dec. 1 – Dec. 30…
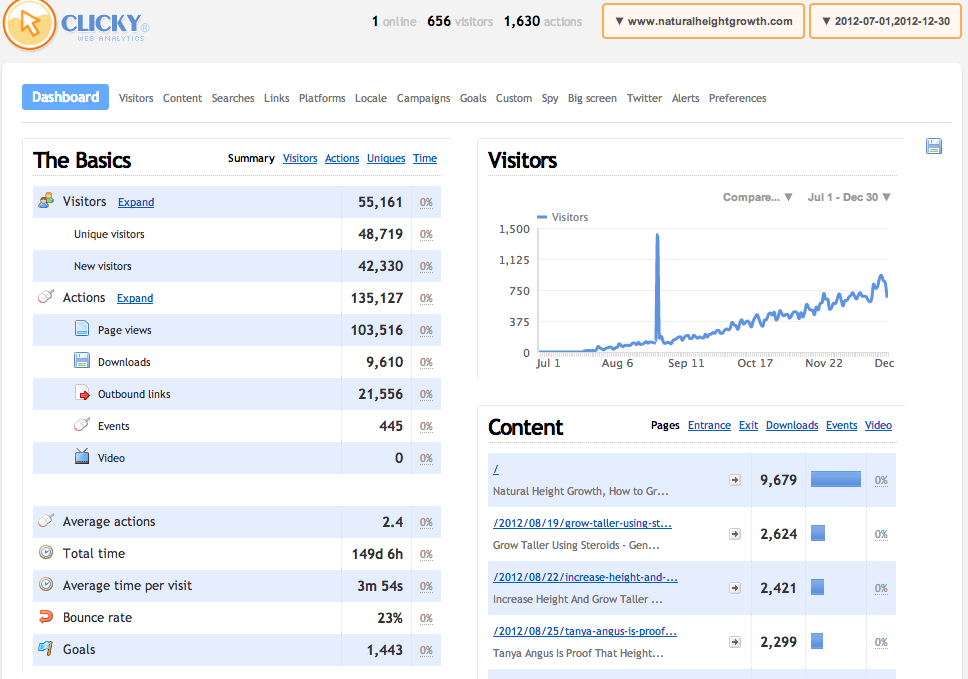
Now for the yearly traffic statistics. Since the website/blog was started around the middle of July, The data range is from July 1 – Dec 30..
Analysis: We can see the website’s humble beginnings in July when I would get maybe 5-10 people to the blog everyday. That was the time when I would write as much as possible and post as much as possible everything I had learned and heard of in the years of knowledge I had accumulated. Sometimes I just enjoyed writing about my thoughts on height and how it affects the rest of society. What is very noticeable is that in the beginning of September, the 1st, the traffic on the website went up really high and was multiplied by 14X. At that time, the traffic to the site was around 100 total visitors a day.
A post on Tanya Angus I did coincided with a the US news networks all choosing to do a story on her story and condition. There pure coincidence my post was on the first page of google search results when you search about Tanya Angus’s height. That lead to traffic which went up to 150 visitors/hour. After that the traffic has been relatively calm and slowly increasing over time. In 5 months, a total of 48,700 unique visitors showed up to the website. The bounce rate is a small at 23% and the amount of time the average visitor spends is almost 4 minutes.